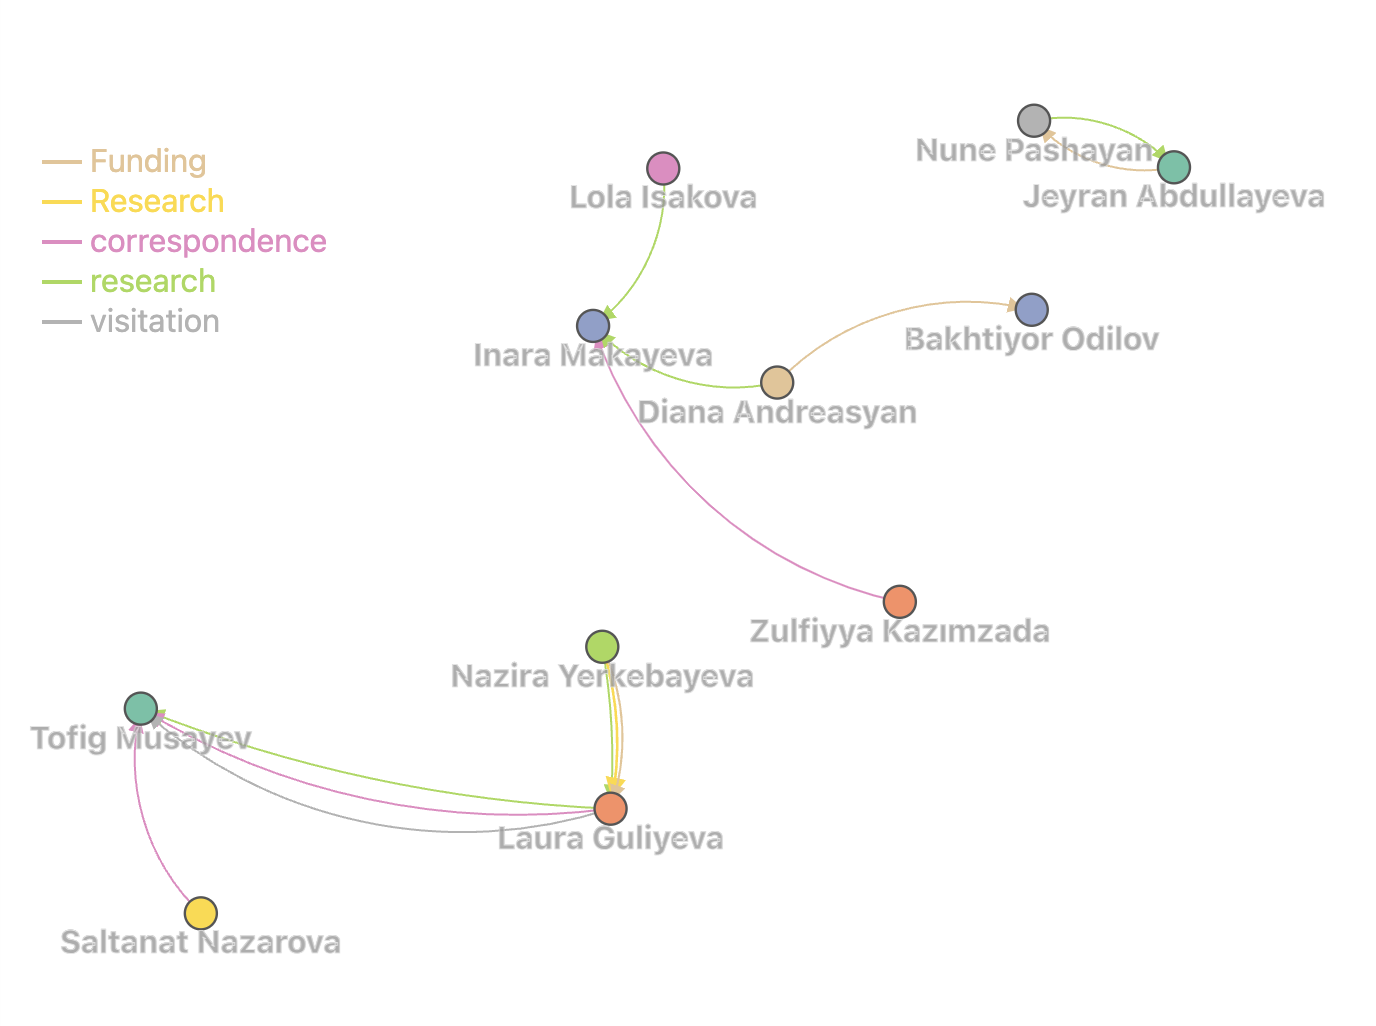
Stakeholder Network Visualization
Discover the power of data visualization with our survey tool. Create interactive graphs that bring your network of stakeholders to life. With real-time analytics, our tool helps you visualize complex relationships.
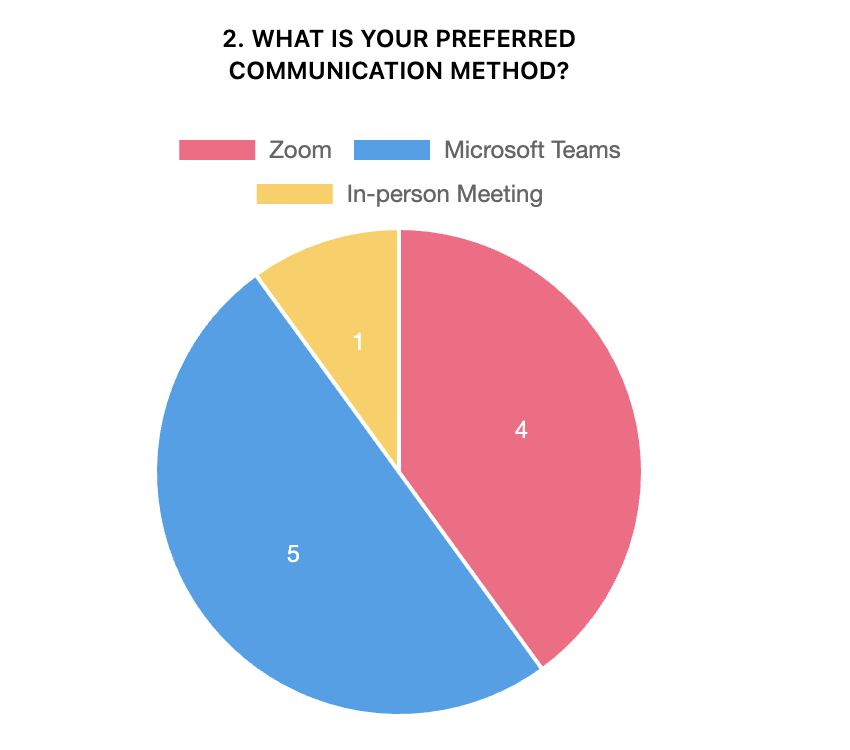
More Visualizations
Bring your survey results to life with our tool's dynamic visualizations. Effortlessly convert responses into compelling bar and pie charts that highlight key insights at a glance.
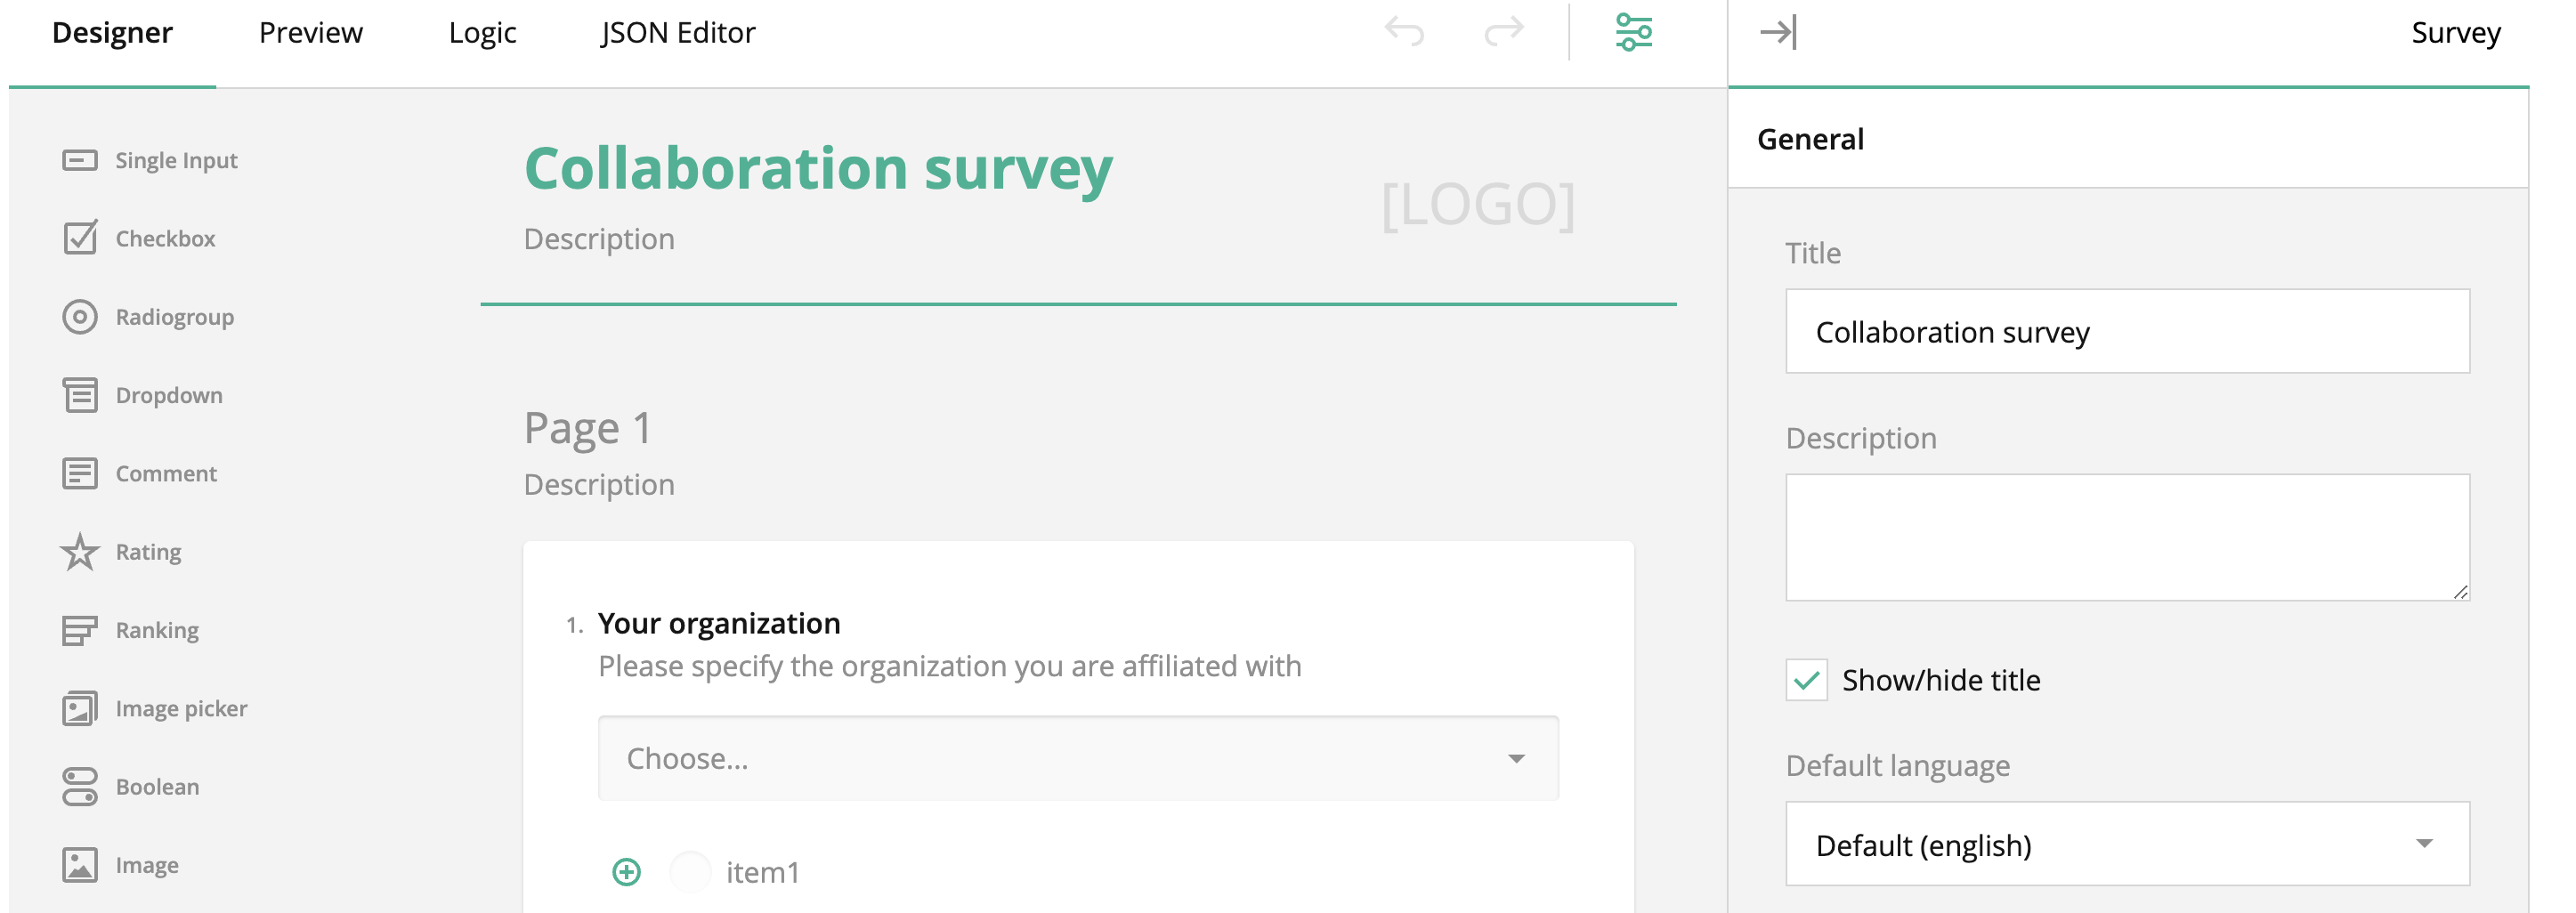
Drag and Drop Survey Tool
Employ our drag-and-drop survey builder to craft and distribute surveys among your project stakeholders.
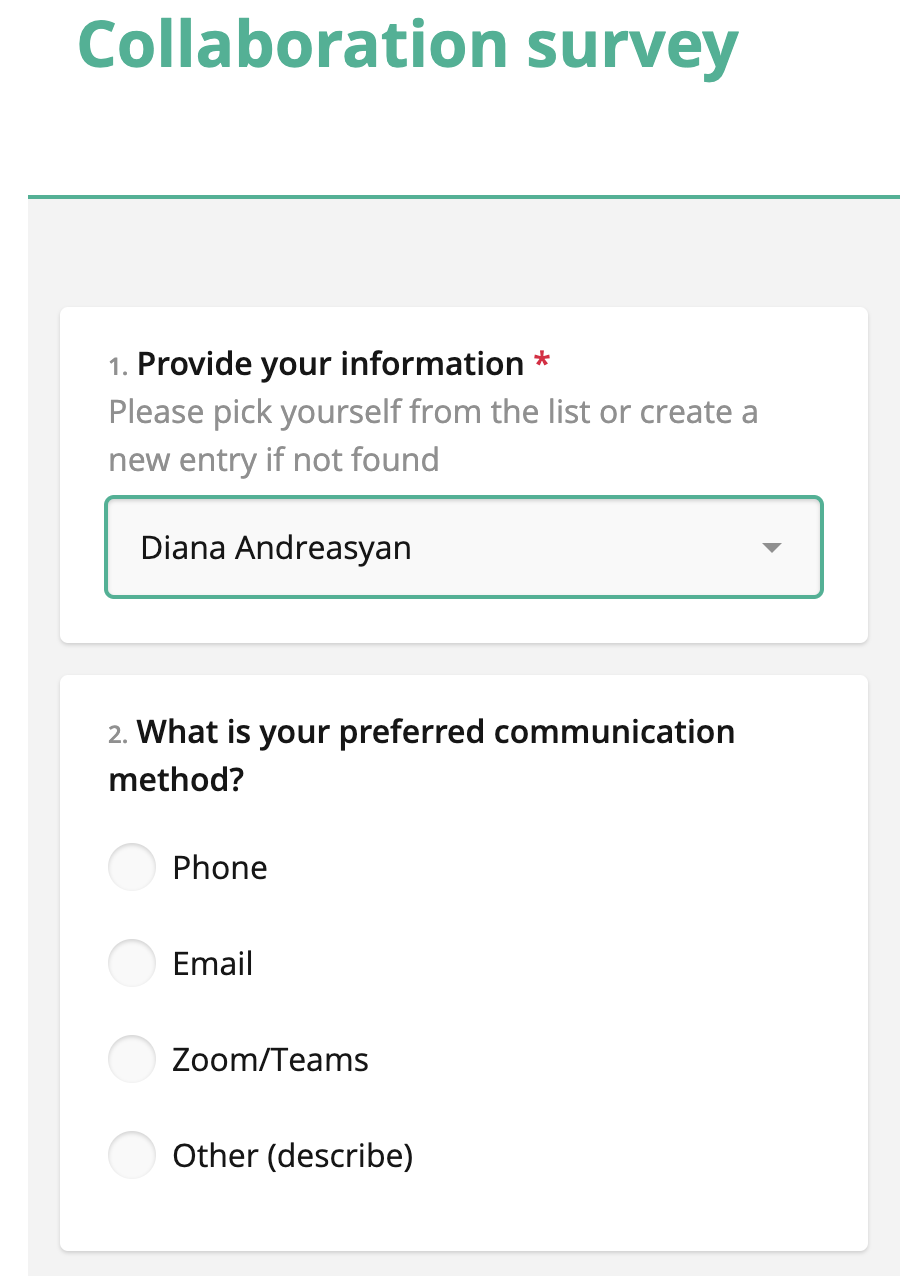
Responsive Design
Our survey tool is fully responsive, ensuring your stakeholders can seamlessly complete your surveys on any device, be it a computer or a phone.